How to define aesthetic mappings of ggplot2 within another function
ggplot2 is great for visualization, but sometimes we need to include ggplot2 functions within another function. ggplot() uses aes() to define aesthetic mappings of different variables. The question is: how to define aesthetic mappings when writing functions using ggplot()? In this post I will present several approaches.
First of all, let’s load the required packages and some test data.
library(ggplot2)
library(dplyr)
data("mtcars")
Using aes_string()
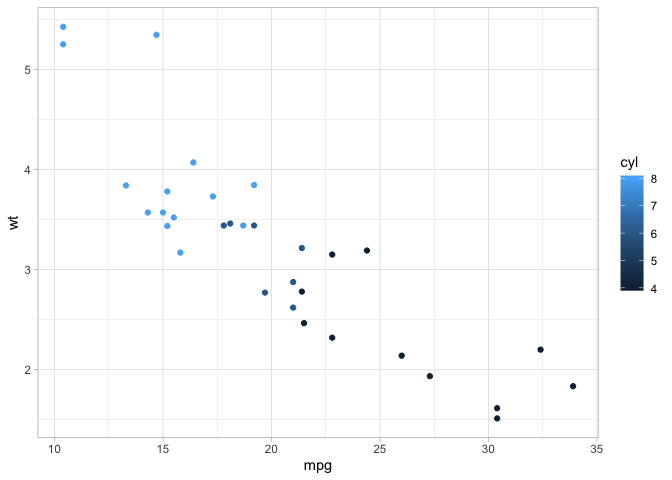
There are two standard ways to define aesthetic mappings in ggplot2, aes_string() and aes_(). Writing a function using aes_string() is the same as using aes(), but calling the function requires passing the variable names as strings to the function.
plot_point_aes_string <- function(data, x, y, c) {
  ggplot(data, aes_string(x, y, color = c)) +
    geom_point() +
    theme_light()
}
plot_point_aes_string(mtcars, "mpg", "wt", "cyl")

Use aes_()
Alternatively, we can use aes_(), which is slightly different from aes_string(). Wrapping aes_() into a function is the same as aes() and aes_string().
plot_point_aes <- function(data, x, y, c) {
  ggplot(data, aes_(x, y, color = c)) +
    geom_point() +
    theme_light()
}
The difference is the way to pass variable names. We can either pass the variable names as one-sided equations (~variable names) or as quotes (quote(variable name)).
plot_point_aes(mtcars, ~mpg, ~wt, ~cyl)
plot_point_aes(mtcars, quote(mpg), quote(wt), quote(cyl))

Another alternative
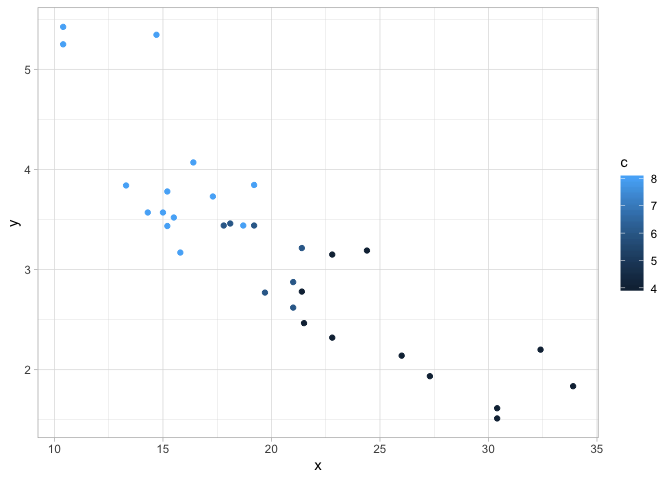
I happened to work out another method which circumvent both aes_string() and aes_(). Simply define the aesthetic mappings in the function, and later rename the variable names in the data.
plot_point <- function(data, x, y, c) {
  ggplot(data, aes(x, y, color = c)) +
    geom_point() +
    theme_light()
}
Applying the tidy approach and using mutate to rename the variable names, which does not cause any side effect to the original data. But one thing to note is that the labels of the axes are what defined in the function.
mtcars %>%
  mutate(x = mpg) %>%
  mutate(y = wt) %>%
  mutate(c = cyl) %>%
  plot_point(mtcars)